19 metrics and KPIs to digitize and boost your digital marketing performance
Cost per click is rising, CTR is falling, and conversion to bid each month shows record numbers in the minus...
The daily increase in competition in all niches of online business is making itself felt in the global distribution of sales. In 2021, even hardcore offlineers are building websites and setting up Direct to sell online. Due to market oversaturation, the standard "Site-Direct" bundle no longer yields the results that were quite acceptable a year or two ago.
To stand out from the general competitive mass, business leaders are creating a brand and quality packaging. It's a work with meaning, content, design and advertising that aims to promote and increase brand awareness.
Why do we need KPIs and metrics?
Often there is no detailed analysis of metrics and KPI for Internet resources (sites, social networks profiles, advertising campaigns), which allows you to know where the money was spent and what result was achieved for each promotion channel.

In this article, you will learn exactly 15 formulas which will help you to find the "black holes" in your budget and adjust your marketing strategy according to the results of your business.
The formulas are suitable for regular analysis of the effectiveness of business processes:
-
By owners;
-
managers;
-
marketers;
-
arbitrageurs;
-
SEO people, etc.
So, let's move on to digitizing a business and collecting key indicators of its effectiveness on the Internet.
Metrics and KPIs
In order to see clearly the current situation of the business, it is necessary to use both tools.
Metrics are specific numbers that can be counted. For example, the number of site visitors, bounces, registrations, payments, etc. A metric is expressed as a specific number of something and helps calculate a specific KPI.
KPIs (Key Performance Indicators) are key performance indicators expressed as a percentage. They help managers in decision making and are used in business planning.
KPIs for Digital Marketing
Each element of the strategy in online marketing can be analyzed and performance data can be seen. Depending on the data obtained, the marketing strategy can be improved, optimized and adjusted.
Such approach allows:
-
Know the sales situation accurately.
-
Evaluate the effectiveness of the site in a measurable result.
-
See the effectiveness of various customer interaction channels.
-
Predict the advertising budget to achieve a specific result.
-
Intentionally grow the business and stay ahead of the competition.
#1 CR - Conversion Rate
Conversion is the percentage of users who complete a targeted action. On a website, this can be filling out an application form, going to a "Contact Us" page, clicking on a button, or watching a video. On social networks: subscribe to a mailing list, join a group, like, repost, etc.
The Google and Yandex statistics services look at conversions according to goals set up in advance.
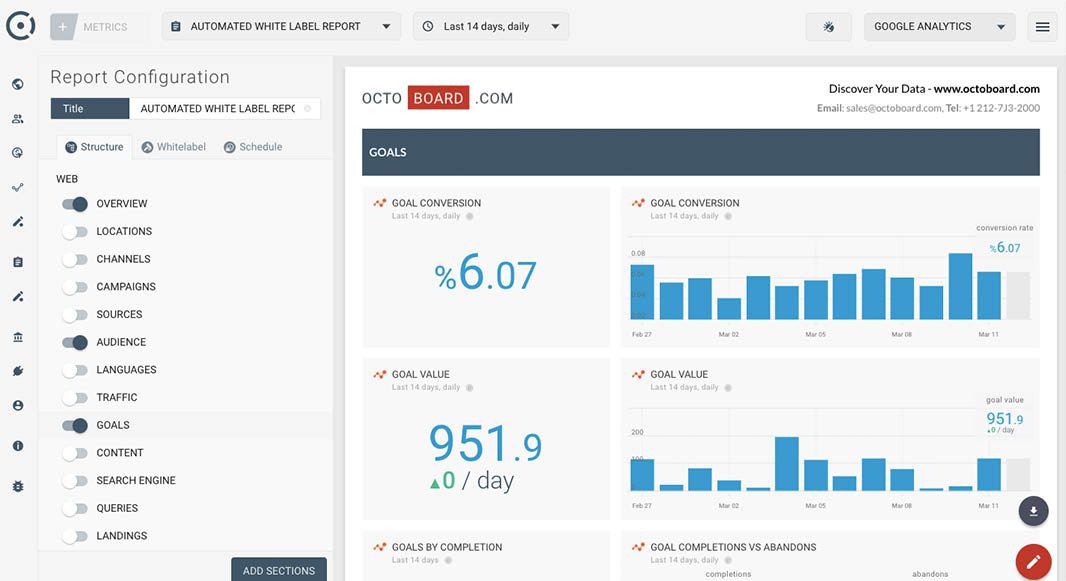
The conversion rate is calculated by dividing the number of users who performed an action by the total number of visitors and multiplying by 100. For example, the sales department received 36 requests. Four sales were made.
CR of the sales department = 4:36*100 = 11,1111111111 = 11% - this is the conversion of the request into payment and the effectiveness of the sales department.
#2 CTR - clickability rate
It is read in the analytics services and in the advertiser's cabinet. It shows the number of users who saw and clicked on the banner, ad or link.
CTR = number of clicks : number of displays x 100
Calculate the CTR with metrics:
(571 clicks : 4 528 displays) x 100% = 12,6% This is a pretty good click-through rate for an ad.
#3 CPC - cost per click
This is the cost per click on your ad, which is different for each advertising platform. It may depend on the quality of your ads and the effectiveness of your advertising campaign.
In Google Ads, CPC is displayed in keyword auctions. Moreover, you can add data from other advertising channels to one report and thus see their effectiveness.
The price per click is calculated using the formula:
CPC = advertising budget : by the number of clicks.
For example, if you have invested 50K in advertising, you will get 2000 clicks.
The price of the click = 50,000: 2000 = 25 rubles.
№4 CPI
The price for installing a mobile application or game by a user of a mobile device purchased with the help of paid advertising. The metric for paid installations is opposed to organic for mobile application statistics.
#5 CPA - price per action
Used by affiliate networks to market the advertiser's own products. Payment is made for the action performed, which the advertiser chooses: sending data, registration, making a deposit, buying a product.
Simply put, CPA is the price of the client.
It is determined by the formula:
CPA = advertising costs : per number of actions.
#6 CPL - cost per lead/application
Determines the budget spent on attracting potential customers. These are the warm and hot audiences who have sent you their information. These categories are not yet customers, but are interested in your product.
CPL helps match the budget spent with the effectiveness of the channel. With the help of buying leads they test new sources of traffic, sell products and services, hold events and build a loyal customer base.
Calculated by the formula:
CPL = advertising costs : per number of leads.
#7 RevShare
A percentage of the profit received by the webmaster. Often works in gambling, when an affiliate receives a percentage of bets made by new players of online casinos. For new webmasters it is better to work with CPA at the beginning and switch to Revenue Share after gaining experience.
The Affcouty affiliate network has a flexible referral system for attracting new webmasters through affiliate partners. It can be set up individually for fixed payouts or a percentage of profit.
#8 Hybrid Payment Model
A combination of CPA and RevShare to generate payouts to webmasters. It may seem that traffic is paid cheaper than usual. But at the end of the project, the percentage of profit can overlap the low CPA rate.
Example of hybrid payment model: If CPA $200 = 1 FTD
The affiliate network offers a combined 10% RevShare + $200 CPA pay per target action.
Trading 4 qualified deposits generates $800 in revenue.
Hybrid payment scheme yields
$800 CPA + $80 RevShare monthly.
#9 CAC - Cost of Customer Engagement
To calculate this metric as accurately as possible, you need to consider all costs for:
- Salaries for the marketing and sales departments.
- Payroll for designers, programmers, copywriters, advertising specialists.
- The advertising budget.
- The budget for SEO-promotion.
- Payment for business intelligence services, etc.
As a result of a scrupulous calculation of all the costs of attraction, you can calculate an indicator that shows the profitability of existing channels to attract traffic. Calculated by the formula:
CAC = all customer attraction costs : number of customers attracted
#10 CAR -Cart Abandonment Statistics
Shows the percentage of users who added an item to cart but didn't make a purchase. If the CAR percentage is high, you need to think about improving the content on the page, making it more user-friendly and updating the information. There seems to be a problem with the usability or functionality of the shopping cart.
To monitor CAR scores in Google Analytics, you need to set up a checkout goal. You can see then abandoned cart ratio in the report: "Conversions-Targets-Consistency Visualization."
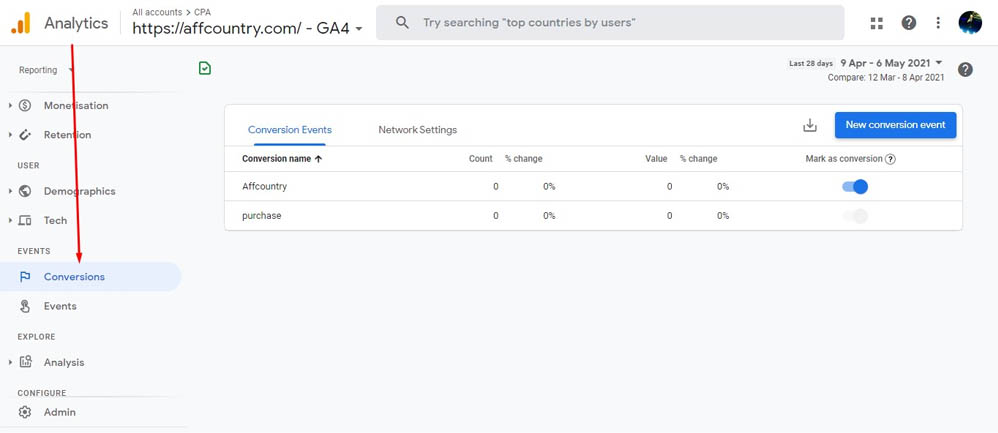
It is calculated by the formula:
CAR = number of cart abandoners : number of cart adders x 100%
#11 ROAS - ROI for Advertising Expenditures
One of the key indicators that can show the problem at its inception. Therefore, digitizing these indicators should be in the regular report of the marketer and promoter of the company. Traffic arbitrageurs actually earn on the ROAS indicator, because the advertiser's payments should overlap the advertising budget already spent.
ROAS — is the profit received from the money spent on advertising.
It is calculated according to the formula:
ROAS = revenue from advertising: advertising costs x 100%.
If the index is more than 100%, the advertising brings profit, if it is less than 100%, the campaign is loss-making. Thus it is possible to determine in a few minutes the effective sources of traffic and to optimize the budget.
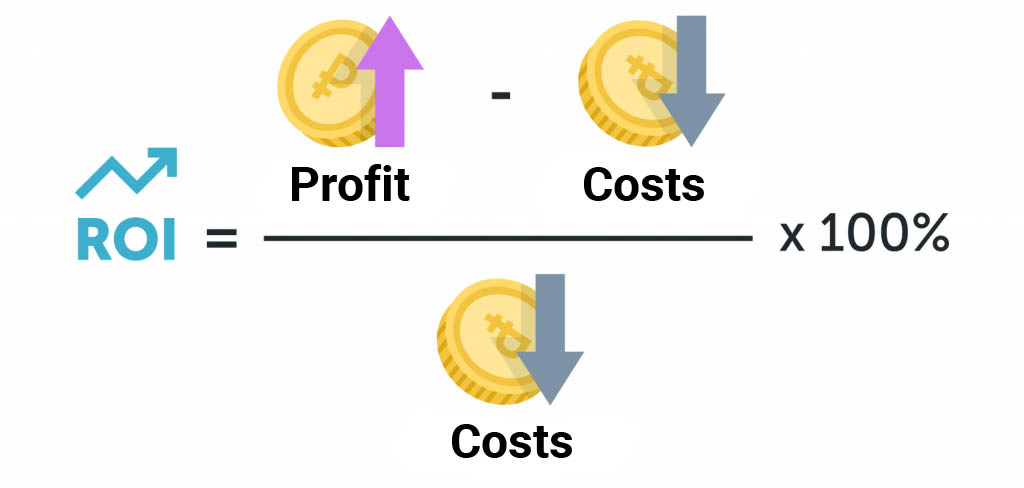
#12 ROI - return on investment
It is a coefficient that shows the return on all investments you make in your business. It is similar to ROAS with the difference that all expenses and investments of the company are counted here as expenses.
#13 ARPU - Average Revenue Per Customer
Determines how much revenue a client brings in over a certain period of time. The knowledge of ARPU helps to forecast the number of sales, depending on the advertising budget.
Calculated by the formula:
ARPU = total revenue : number of customers
# 14 CAC - client payback period
How long it takes to get back the money spent on attracting a client. This metric allows you to build predictable long sales funnels with complex products.
CAC = cost to attract a customer : average revenue per customer
#15 MRR - recurring revenue over a period of time
Used to forecast revenue and plan projects with pay-per-subscription and recurring payments. Allows you to know the income per user for a certain period of time.
MRR = average monthly income per user : number of users.
#16 Churn Rate
This metric is important for any business, which is aimed at creating a loyal client base. It allows you to monitor the customer churn rate and react timely.

Churn Rate = number of clients that left during the period : number of clients at the beginning of the period x 100%.
#17 SOM - occupied market share
The metric helps to track market share and see the overall trend in a niche. It is used in business planning and performance monitoring. A positive trend in SOM always motivates you to do more and helps to grow your business.
SOM = your sales : total sales in the niche x 100%
#18 CRR - customer retention rate
A very important KPI for the business, which should be monitored regularly and watched for the slightest decrease. A CRR above 100% indicates a sufficient level of customer confidence. 100% or less - is already a reason to reconsider the work on customer retention.
CRR = difference between total amount of clients for the period and new clients : amount of clients at the beginning of period x 100%
#19 LTV/PLV
Helps to focus on those channels that bring in the best clients.The quality of traffic is measured from one month and even up to six months. Determining what period of time to take depends on the vertical and on the specific offer. It's better to optimize your marketing channels based on the revenue a customer brings in over time, rather than the revenue from their initial purchase. Consequently, you can maximize a customer's lifetime value relative to the cost of attracting a new customer (CAC).